When aggregating all races, the age-standardised mortality rate due to police violence was 0·25 (0·24–0·26) per 100 000 in the 1980s and 0·34 (0·34–0·35) per 100 000 in the 2010s, an increase of 38·4%…
That’s from a 2021 paper in The Lancet by the Global Burden of Disease police violence collaborators. Its headline finding got most of the attention, and deservedly so: death certificates missed more than half of all deaths from police violence between 1980 and 2018. But the line above made its way into a lot of conversations too, usually compressed into something like “police are killing more people now than in the 1980s.”
I wasn’t so sure. That paper is the reason I started building an agency-level dataset of people shot and killed by police, going back as far as I could find records. This post explains why I was skeptical and what the data can and can’t tell us.
What the Lancet paper did
The authors started with four sources:
- Death certificates (the National Vital Statistics System, or NVSS), back to 1980;
- Fatal Encounters, from 2005;
- Mapping Police Violence, from 2013;
- The Guardian’s The Counted, for 2015–16 only.
They treated The Counted as the gold standard, estimated how much each of the other sources over- or under-counted relative to it, scaled each source up or down accordingly, and fit a smoothed trend through the corrected numbers from 1980 to 2019.1
That’s a reasonable way to fix an undercount. The question is what it does to a trend.
Why I was skeptical
Before 2005, the only data going into the model are death certificates. So the estimate for the 1980s is, in effect, the number of police-violence deaths recorded on death certificates in the 1980s, multiplied by how badly death certificates undercounted those deaths in 2015 and 2016. The model assumes death certificates missed police killings at roughly the same rate in 1980 as they did 35 years later.
That matters because raw death-certificate counts roughly doubled over the period, from about 300 a year in the early 1980s to about 600 by 2018.2 If medical examiners and coroners simply got better at recording police involvement over those decades, part of the “increase” is the paperwork catching up — not more people dying.
There’s a similar issue on the back end. Fatal Encounters’ counts climb from roughly 900 deaths in 2005 to about 1,450 in 2019, and the model assumes its coverage held steady the whole time, even though the sources it’s checked against don’t exist before 2013. That’s a big assumption. Fatal Encounters launched in 2012, when Google Alerts made near real-time tracking possible; earlier years were filled in retroactively and are almost certainly less complete. A recent comparison with the FBI’s Supplementary Homicide Reports found exactly that: Fatal Encounters appears to undercount police-caused homicides before 2010.3
None of this means the Lancet estimates are wrong. It means the long-run trend rests on an assumption that can’t be checked with the data in the paper. (Two smaller differences: their outcome includes every death from police violence, not just shootings, and it’s a rate rather than a count. Because the U.S. population grew about 45% over the period, a 38% rise in the rate implies the annual number of deaths roughly doubled.)
What we need is a record that doesn’t depend on how death certificates were coded. Many police departments have tracked their own shootings for decades, so I started collecting those counts, agency by agency.
The data
The dataset has grown one source at a time: Geller and Scott’s Deadly Force: What We Know for the 1970s and 80s, news investigations in Florida, Georgia, Minnesota, and Utah, open data portals in cities like Dallas and Phoenix, and departmental reports that VIPR Lab student Ash Bruha tracked down. It now covers 414 agencies.
This fall, with the help of an AI coding assistant (Claude), I rebuilt it as a single agency-year panel that sets my counts beside The Washington Post’s Fatal Force data, Fatal Encounters, and Mapping Police Violence. Every number, table, and figure is generated by code you can rerun.4 Where the sources overlap, they agree closely: my counts and the Post’s match exactly in 95% of agency-years.
What the data show
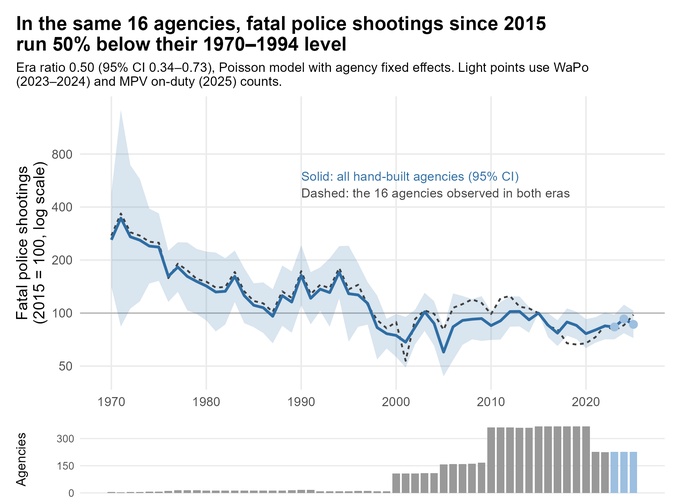
The figure below compares each agency only to itself, so agencies entering or leaving the data don’t move the line.5
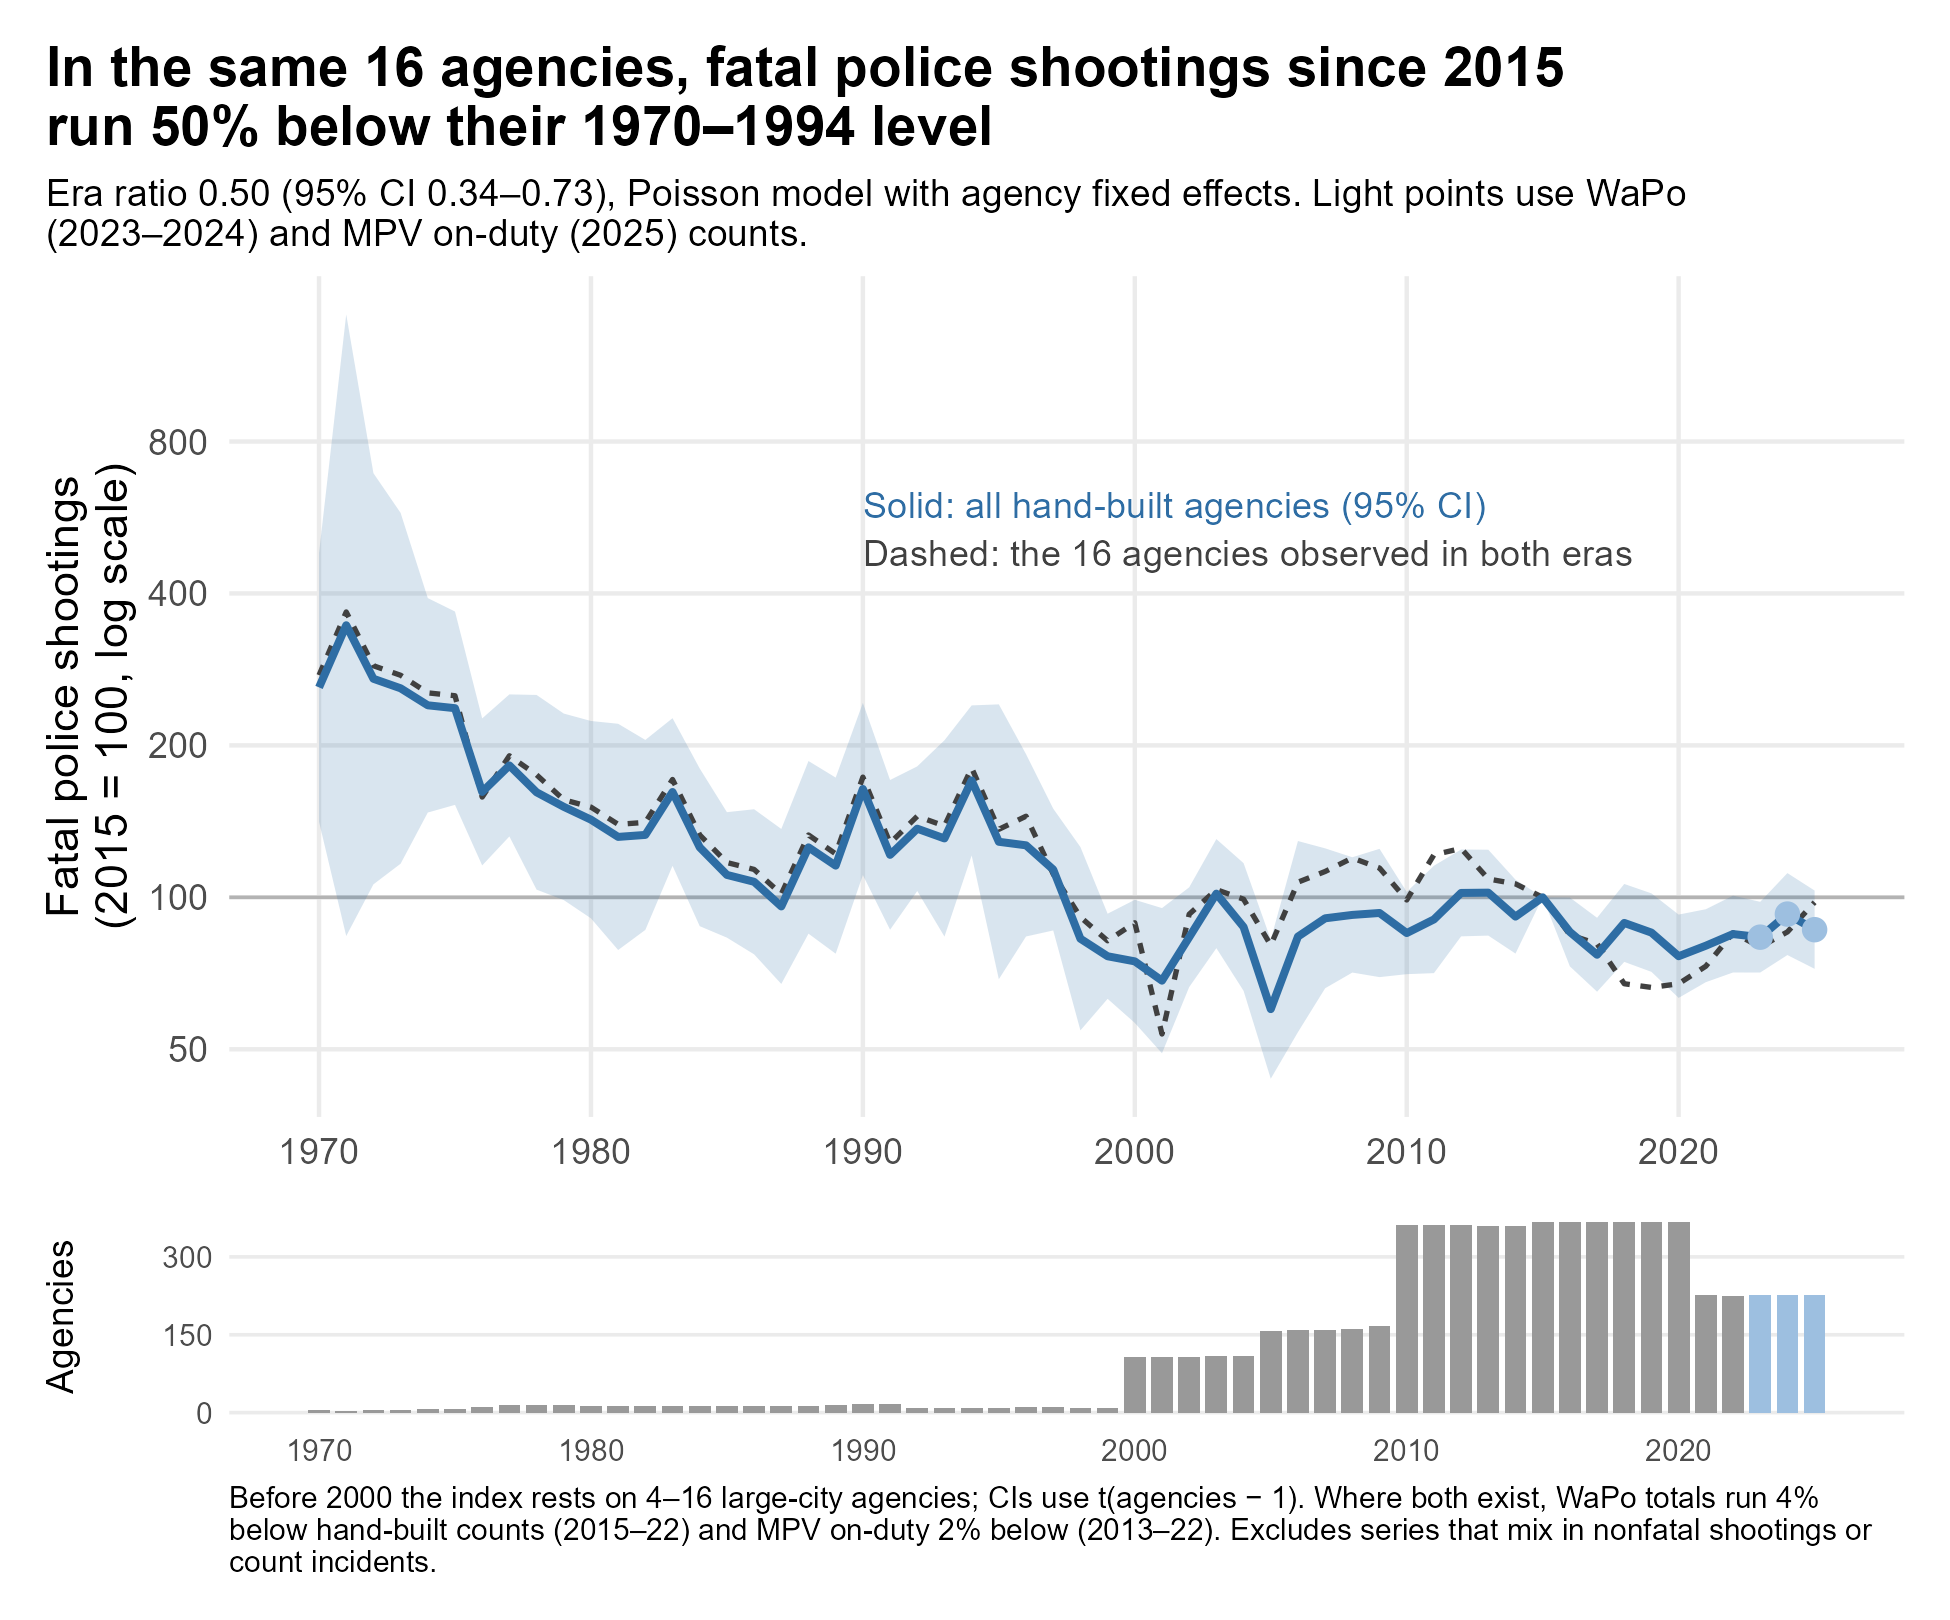
The headline comparison (the dashed line) uses the 16 agencies with at least five years of data both before 1995 and since 2015. In those agencies, fatal police shootings since 2015 have run about half their 1970–1994 level: 50% lower, with an uncertainty range of 27% to 66% lower.
Here are those 16 agencies one by one:
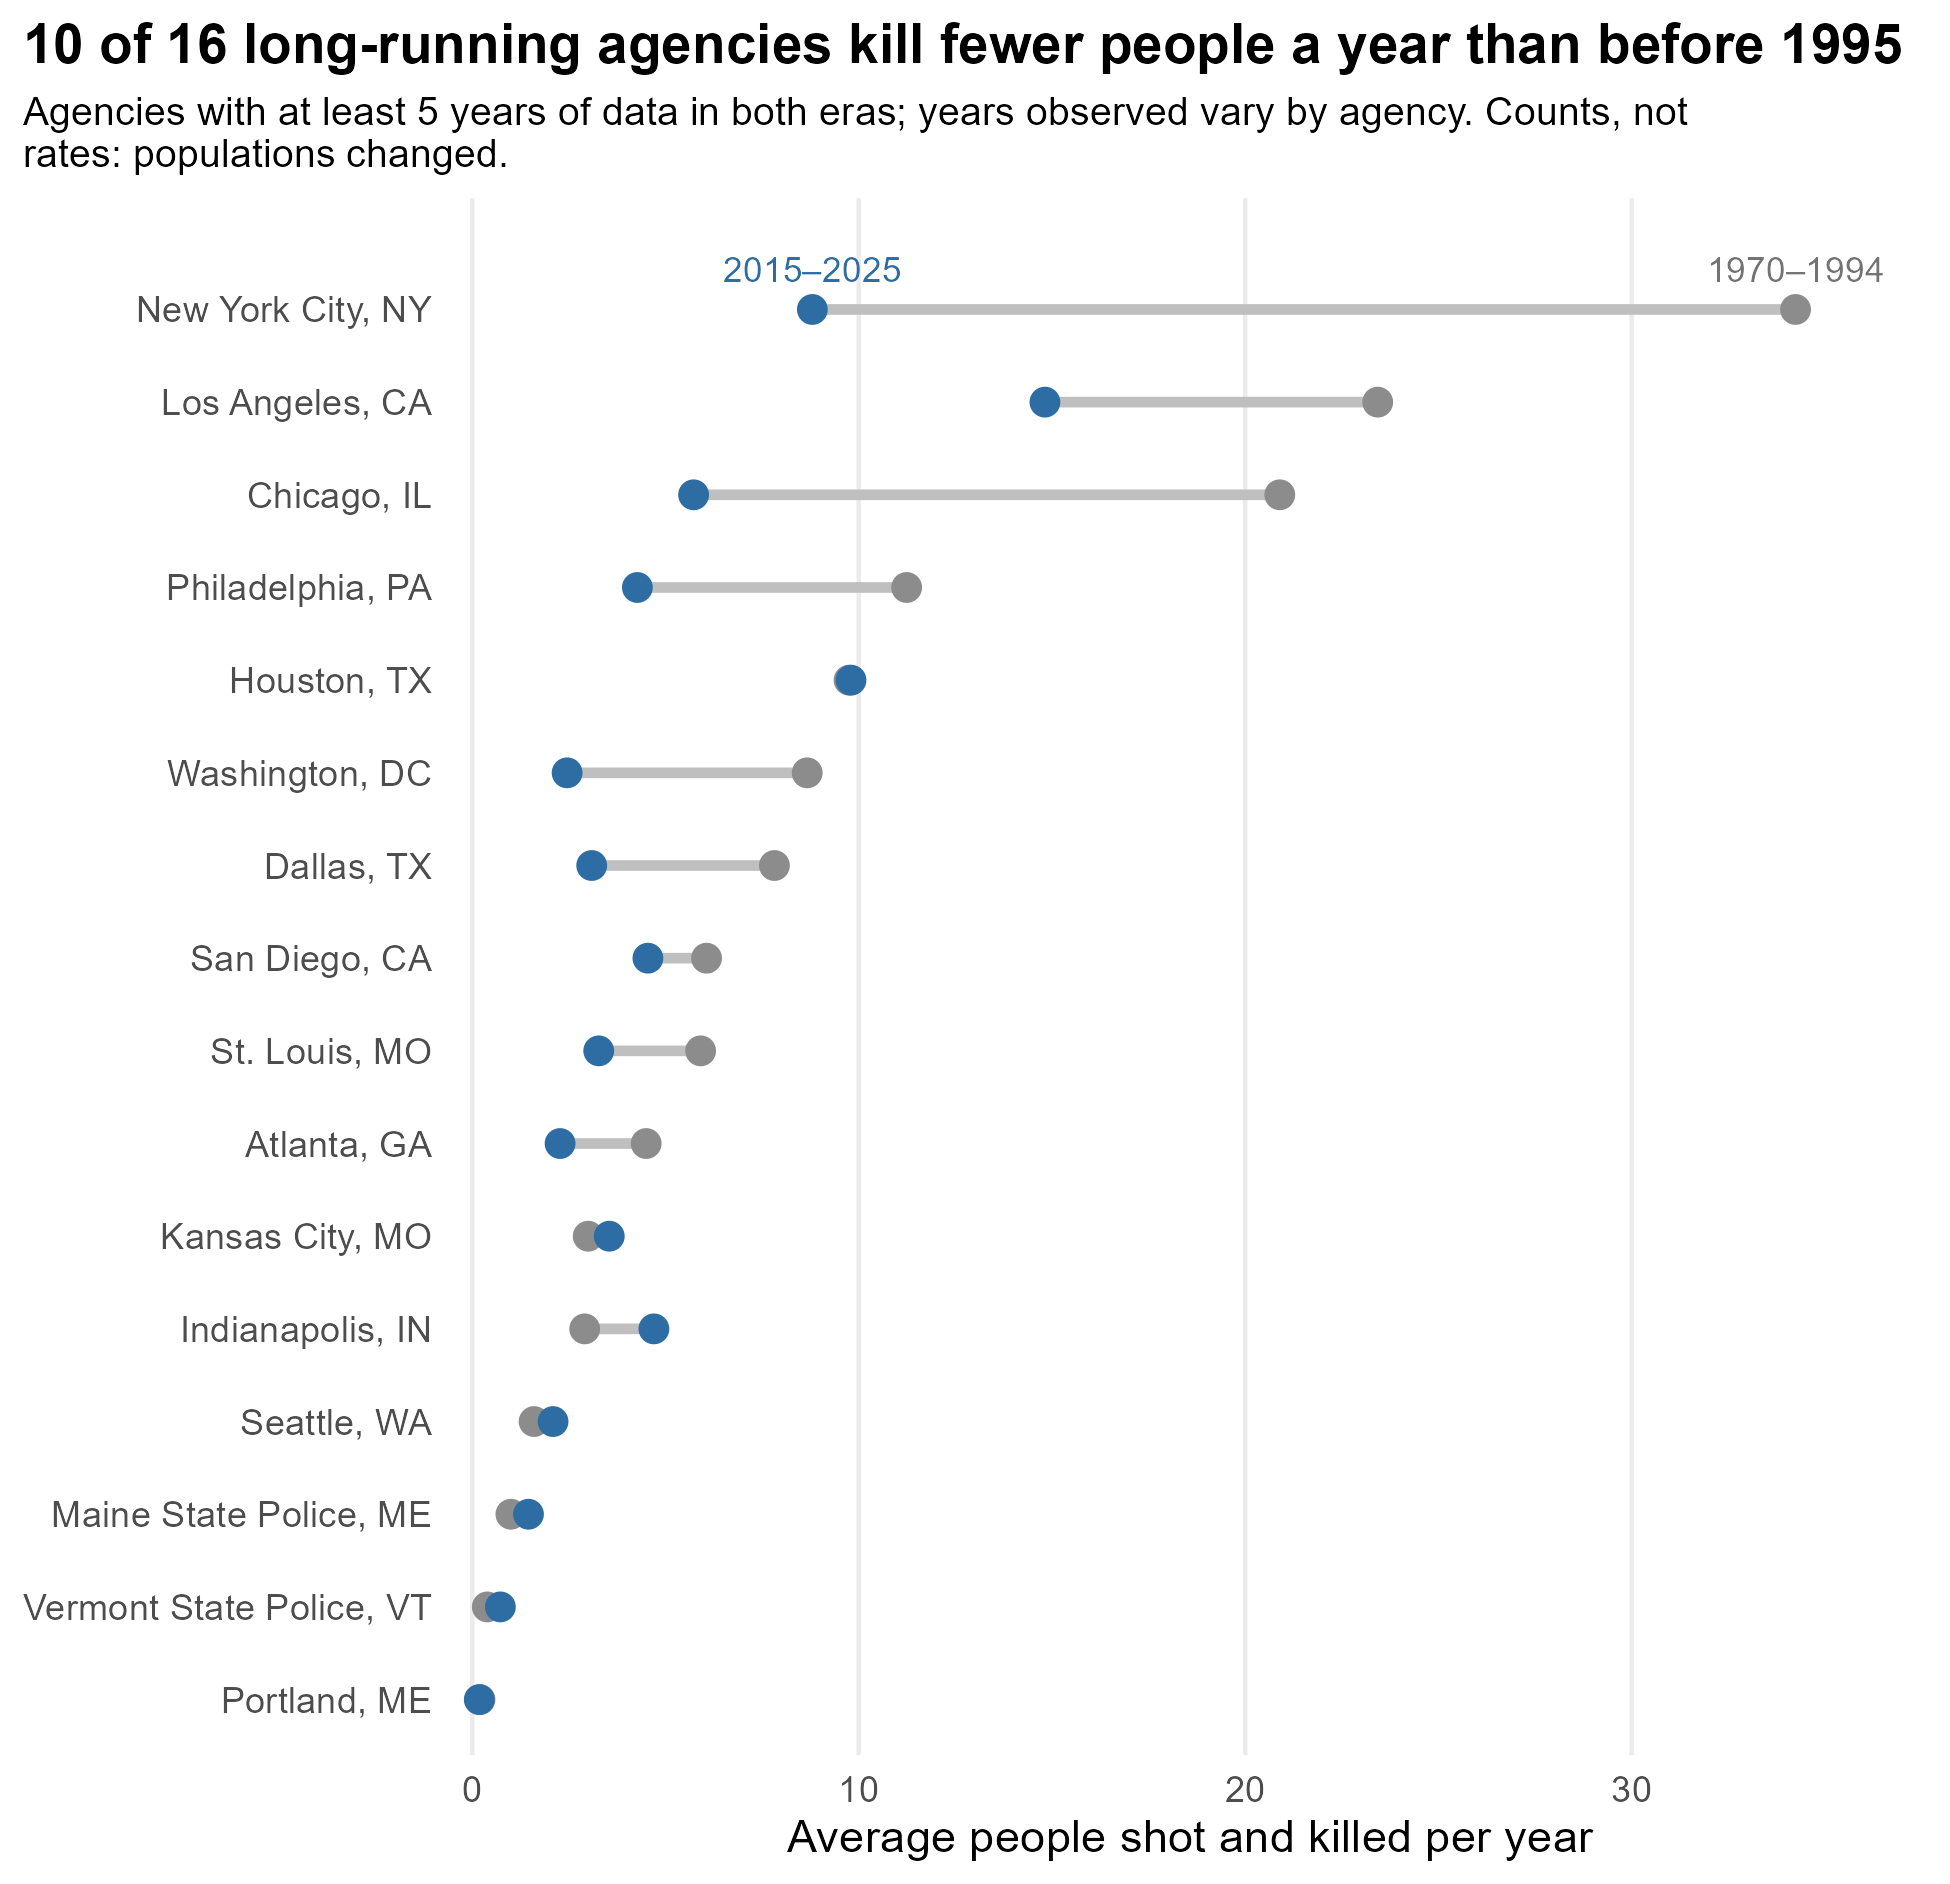
Ten of the 16 kill fewer people a year now than before 1995. For example, here’s what the data show for America’s three largest cities:
| Agency | Before 1995 (per year) | Since 2015 (per year) |
|---|---|---|
| NYPD | about 34 | about 9 |
| Los Angeles | about 23 | about 15 |
| Chicago | about 21 | about 6 |
The pattern isn’t uniform. Indianapolis is noticeably higher now, and a few smaller agencies are flat or slightly up. And these are counts, not rates; adjusting for population growth or decline could move individual comparisons in either direction.6
What we can and can’t say
What we can say. In the agencies we can follow for 50 years (mostly large cities), fatal police shootings are lower now than they were in the 1970s, 80s, and early 90s. That sits uneasily with a national increase over the same period, and it’s consistent with the possibility that some of the Lancet paper’s rise reflects better death-certificate coding rather than more killings.
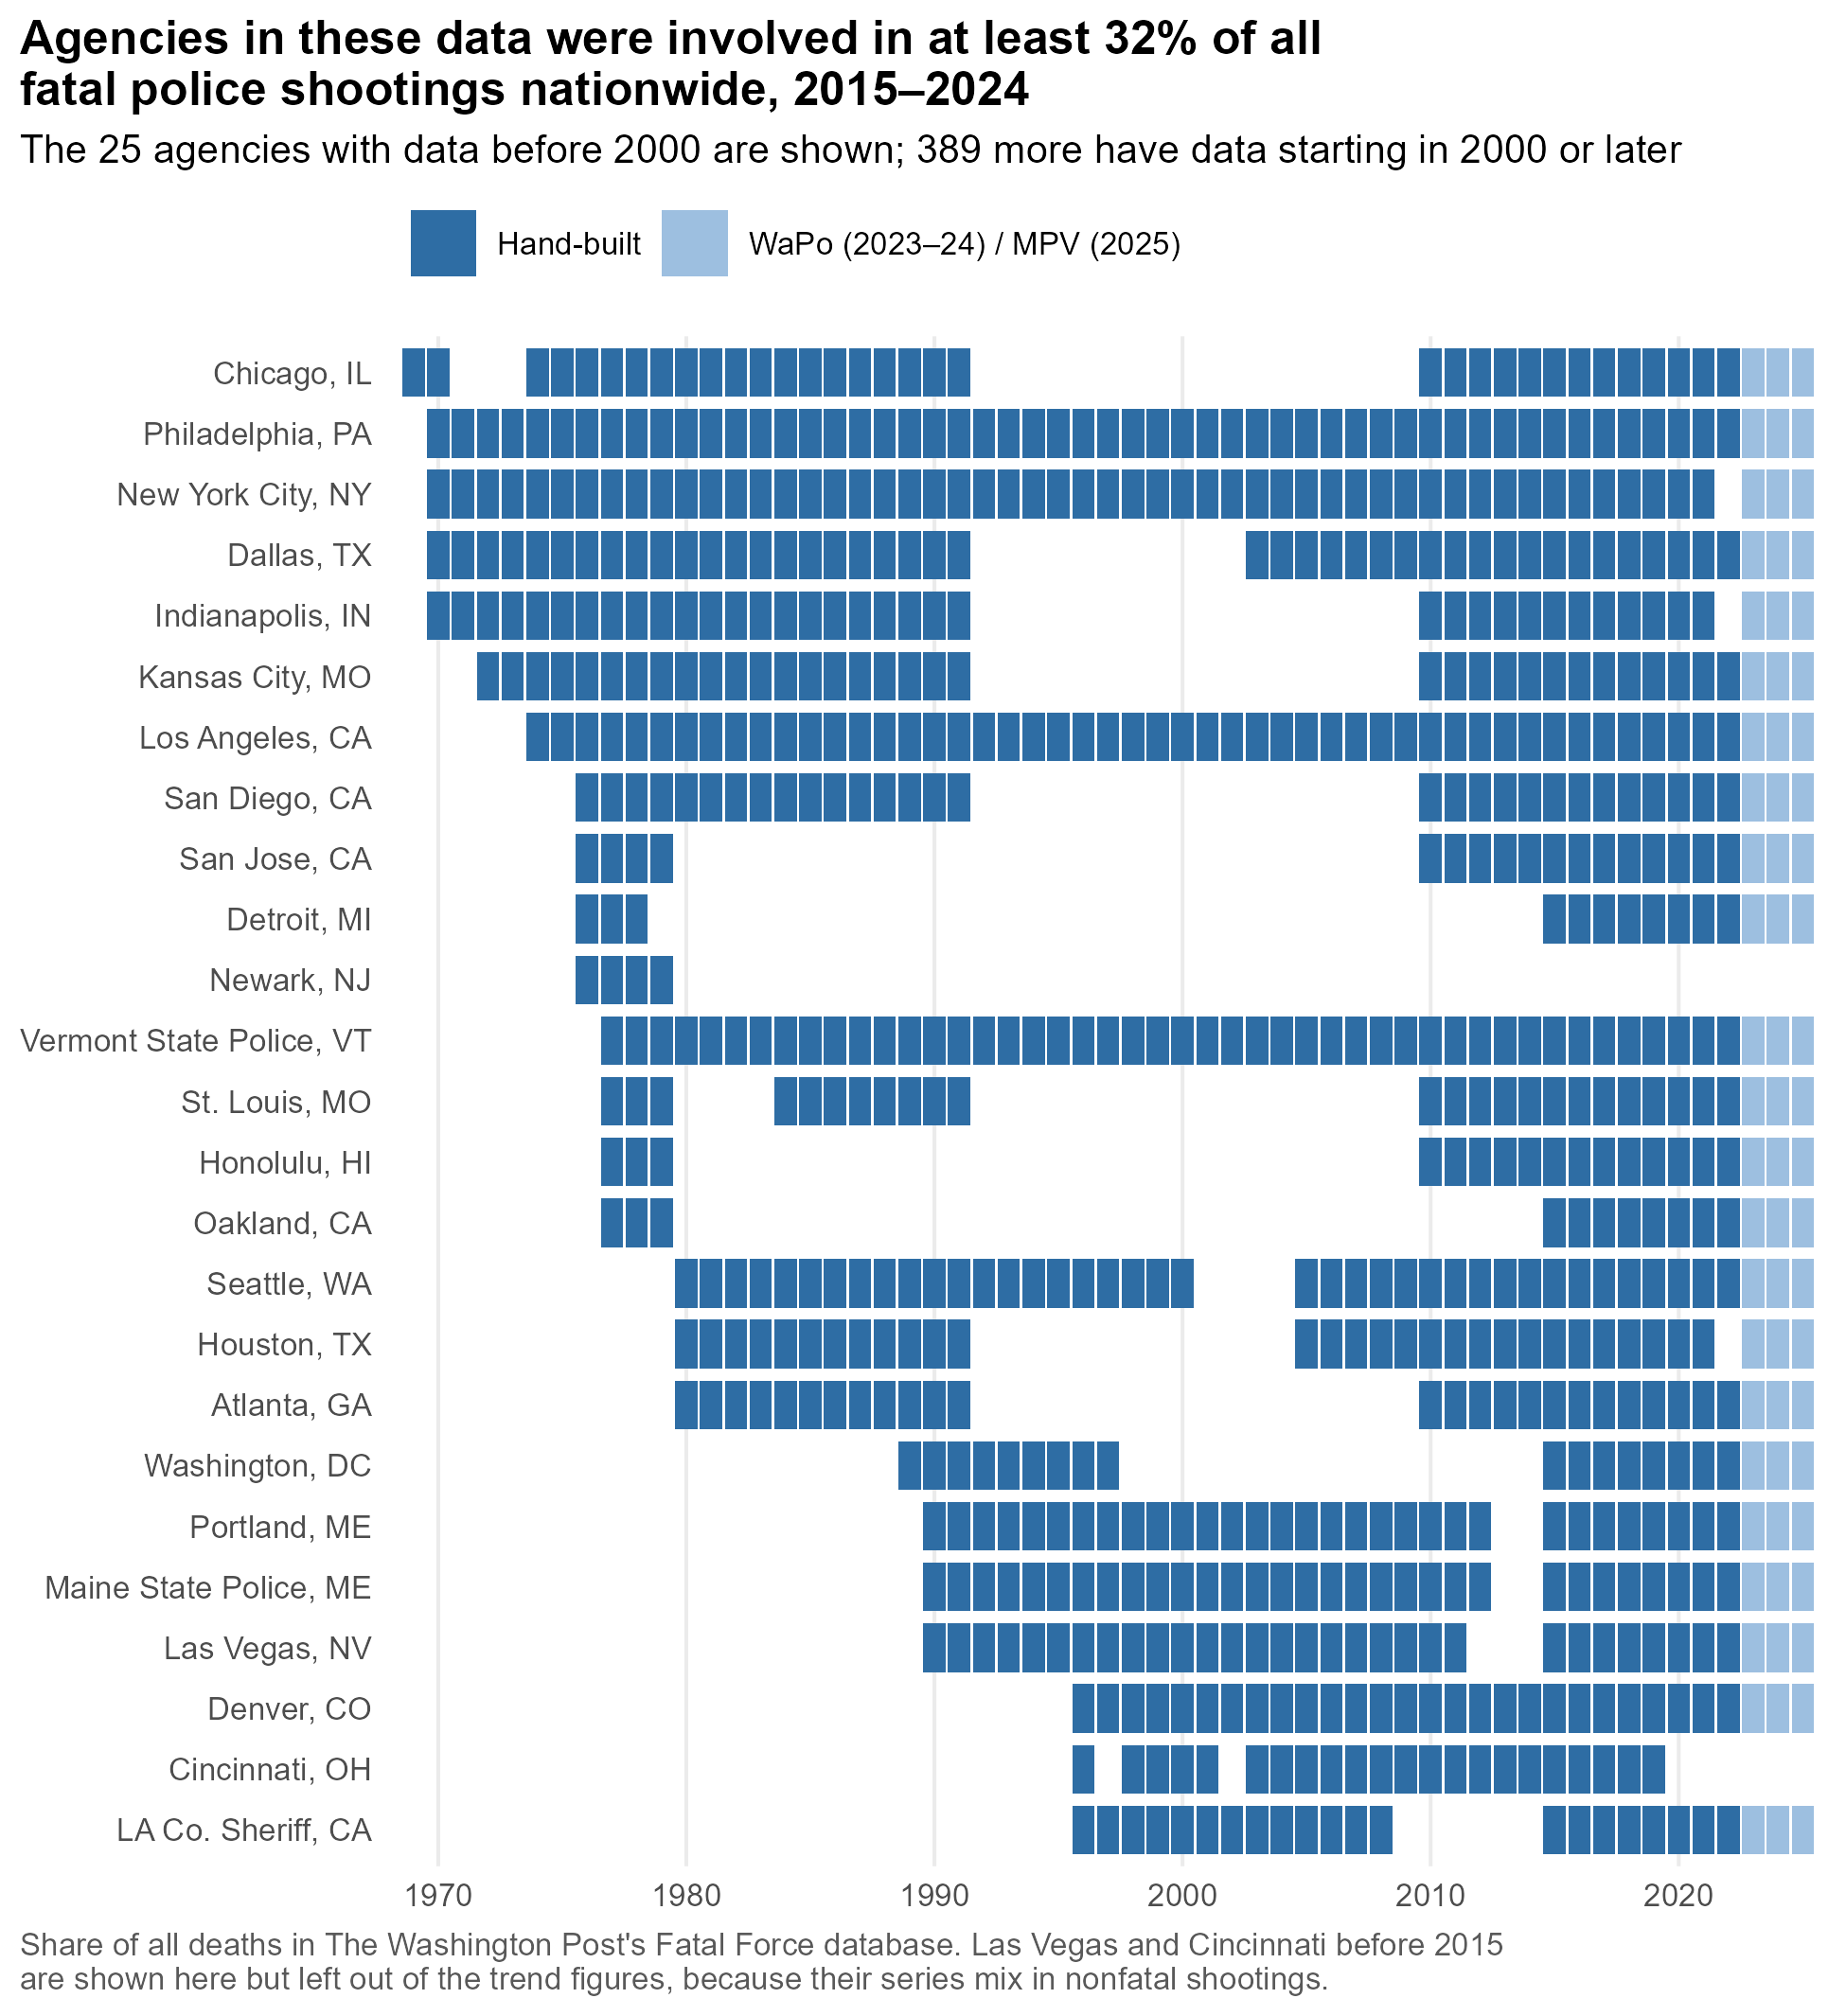
What we can’t say. Whether the national number of people killed by police is higher or lower than in the 1980s. Sixteen big cities aren’t nationally representative, and my 414 agencies aren’t a random sample. They have breadth (they were involved in at least 32% of everyone shot and killed by police nationwide from 2015 to 2024) but not depth: only 25 have any data before 2000, and several of those series have long gaps.
Can you help?
If you know where historical counts of fatal police shootings live for any agency — an annual report, a consent decree filing, an old newspaper series, a dissertation appendix — I’d love to hear about it. Chicago from 1992 to 2009 would be a great start. Email me, or open an issue on GitHub.
Claims about long-run national trends, in either direction, are still running ahead of the data. I’m hoping we can close some of that gap.
-
Technically, a “network meta-regression” estimated each source’s correction factor by state and racial group, and a smoothing model was fit through all of the corrected numbers. ↩︎
-
These are my reads off the paper’s Figure 2, which plots each source’s raw annual counts before and after correction. The paper doesn’t report the raw series in a table. The model does let the death-certificate undercount vary by state, race, and the share of deaths involving a firearm, but not over time. ↩︎
-
The authors dropped Fatal Encounters’ 2000–2004 data over completeness concerns, so they knew early coverage was an issue; they just drew the line at 2005. Crowdsourced coverage growing over time isn’t hypothetical. When I line up Mapping Police Violence against my own counts for the same agencies, it runs about 10% lower in 2013–15. By 2020–22 it runs a few percent higher. That’s the pattern you’d expect if the database got better at finding deaths over time, which is exactly what it’s supposed to do. But it means a trend built from a single crowdsourced source can drift upward on its own. ↩︎
-
Coverage by source: the Post (2015–2024), Fatal Encounters (2000–2021), and Mapping Police Violence (2013–present). Mapping Police Violence is the one national source still updating, so the panel can keep growing. Linking Fatal Encounters meant matching its free-text agency names to FBI agency codes; every match is either an exact name match or a decision I recorded by hand, and about 89% of its fatal shootings now link to an agency. The rebuild also caught errors in my own data: five agencies had been matched to the wrong FBI code, and the old merge with the Post’s data had missed 96 agencies listed under more than one code. ↩︎
-
For the curious: a Poisson regression with agency fixed effects, with 2015 as the reference year. The code is in
scripts/07_figures_trends.R. Every number in this post comes from a table that script writes, so if I’ve gotten something wrong, it should be easy to find. Considerations: (1) My counts run through 2022. For 2023–24 I filled in the Post’s counts, and for 2025 MPV’s. (2) I left out series that mix in nonfatal shootings or may count incidents rather than people. (3) Before 2000, the trend rests on just 4 to 16 big-city departments. ↩︎ -
Some of these cities have grown and others, like St. Louis and Philadelphia, have shrunk. The years observed in each era also vary by agency. DC’s early window, for example, is 1989–94. The table lists each agency’s years. ↩︎