
In a forthcoming paper in Criminology & Public Policy, Michael and I conducted an exploratory analysis of fatal and non-fatal firearm assaults on U.S police officers using six years of public data provided by the Gun Violence Archive. We adopted the following inclusion criteria:
- Victim was a sworn officer employed by a local, state, or special jurisdiction law enforcement agency that routinely responds to calls for service (i.e., officers employed by town, city, or county agencies, sheriff’s departments, state agencies, tribal police, university police, transit police)
- Victim was on duty at the time of assault
- The bullet struck the victim’s person or his/her equipment (excluding vehicle)
- The bullet came from a real firearm (i.e., not a pellet/BB gun or shrapnel from an explosion)
- The shooter was not a police officer
We excluded off-duty firearm injuries, self-inflicted injuries (whether accidental or intentional), and injuries resulting from friendly fire. Our analysis also omitted cases in which a suspect fired at but did not strike an officer.
We identified 1,467 officers who were assaulted by gunfire across 1,185 incidents (1.24 officers per incident). Of them, 249 died and 1,218 survived. This underscores the importance of examining nonlethal shootings alongside fatal shootings in order to understand the true prevalence of potentially lethal violence against police officers.
At the national level, the rate of firearm assaults per 100,000 sworn officers has fluctuated between 29.9 and 44.1 over the last six years. Though there was a notable spike in 2016, the data don’t provide clear evidence of a significant increase in firearm assaults of police officers over this period. This finding is in line with a recent analysis by Michael White that focused on ambush-style attacks on police: despite some single-year spikes, there is no evidence of a longitudinal increase in ambushes against police.
At the state level, the number of firearm assaults ranged from a low of 2 (in Delaware, Montana, North Dakota, Rhode Island, and Vermont) to a high of 143 in Texas:
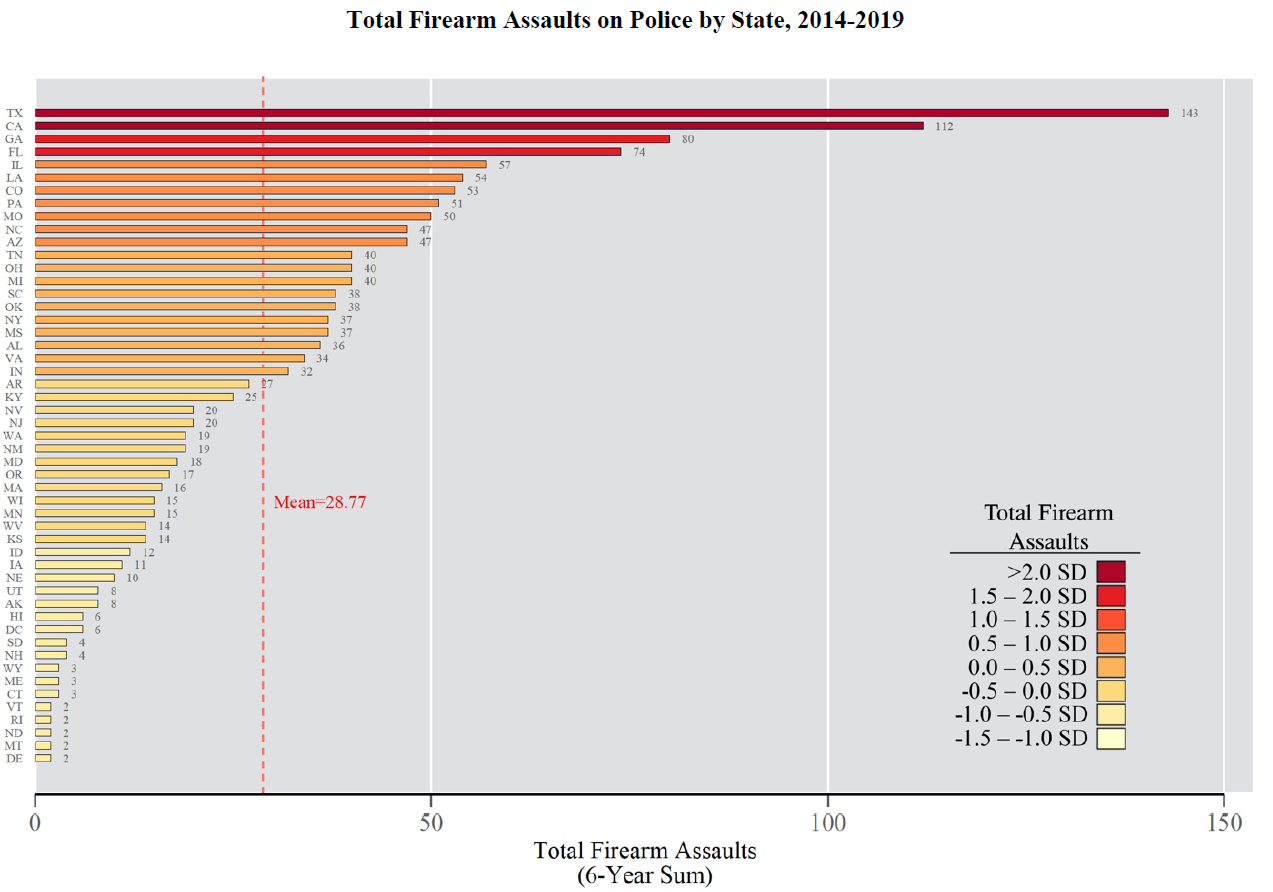
This ordering is unsurprising for a simple reason: there are far more officers in Texas than most other states. To account for differences across states in the number of police officers, we calculated state-level rates per 1,000 officers using Police Employee data provided by the FBI. Using these rates provides a different view of the relative incidence of firearm assault across states.
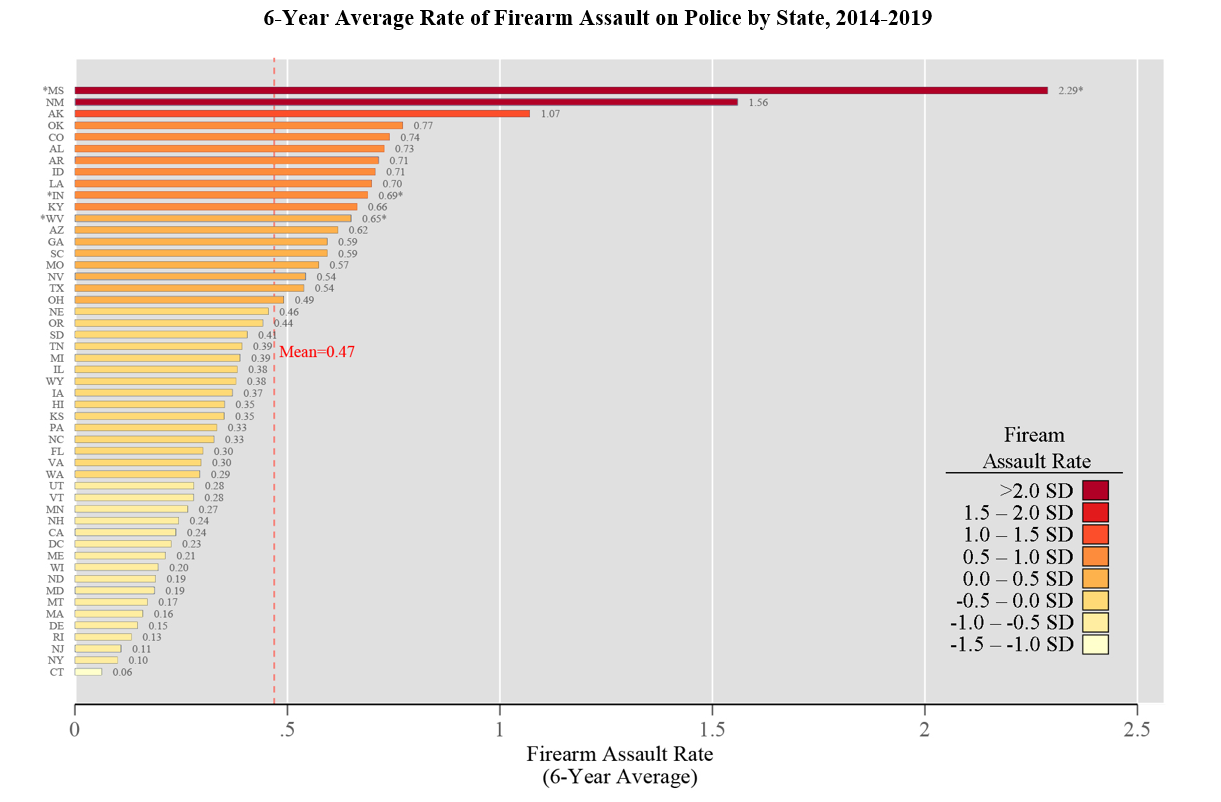
Instead of being at the top of the list, Texas falls to 18th. California, which has the 2nd highest frequency of firearm assault on police, falls to 38th when using a rate. Overall, rates varied from a low of 0.06 firearm assaults per 1,000 officers in Connecticut to a high of 1.56 per 1,000 in New Mexico (at first glance, Mississippi’s rate is higher, but this rate is biased by statewide underreporting of Police Employee data to the UCR).
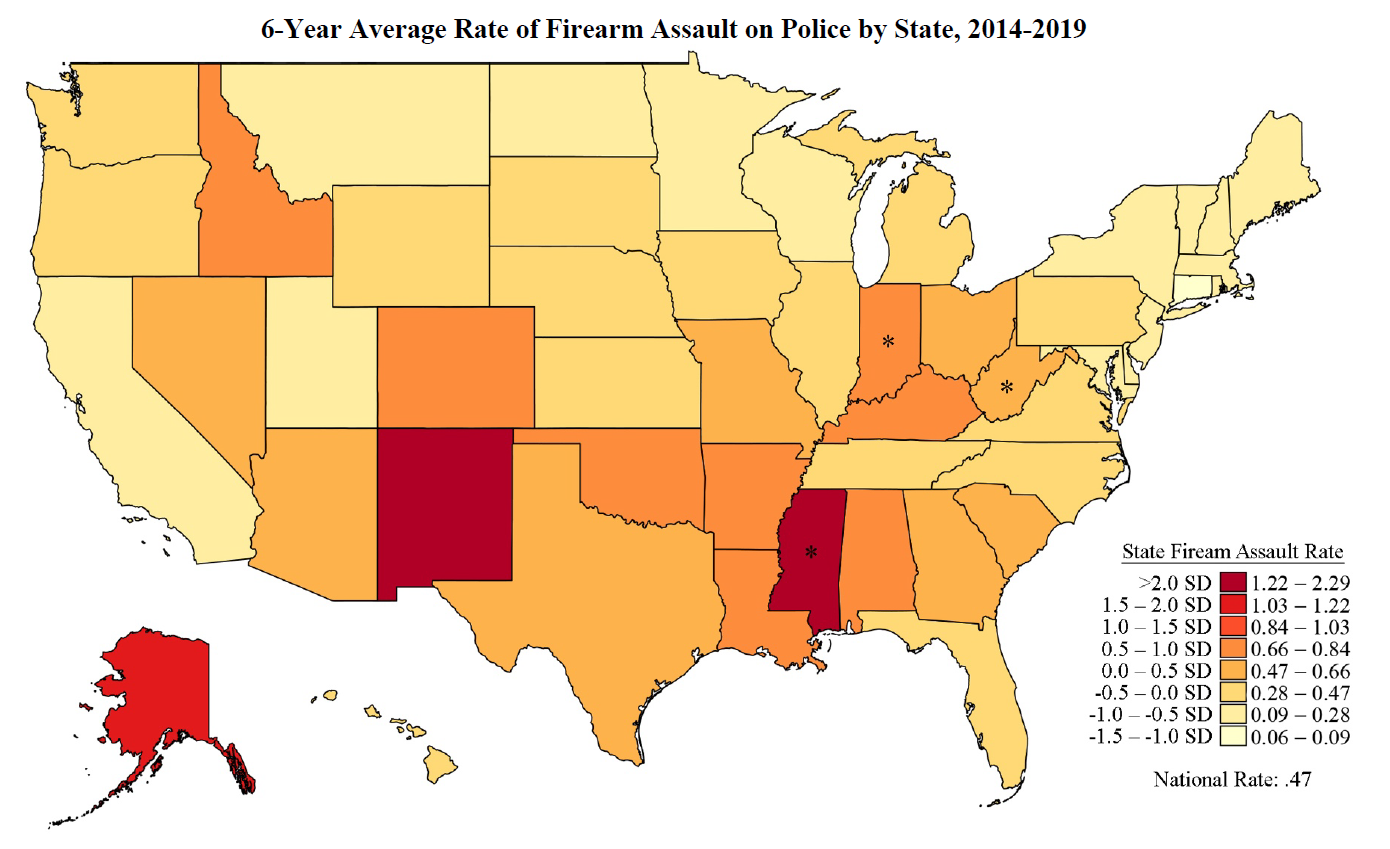
When looking at things spatially, some interesting patterns emerge. Generally, Northeastern states have a lower firearm assault rate than states in the South Eastern and South Western United States. However, the story is not strictly regional: Utah and California’s rates, for example, are more similar to New York and Massachusetts than to nearby Arizona and New Mexico.
The behind the scenes work with GVA data also provides some really important lessons for future work. Early on, we made the decision to manually vet each case by using the news story URLs that GVA includes with each assault record. In cases where links were dead or missing, we did manual searches using the listed date, location, and other details to try and find an online record with which to verify case details. I shudder remembering about how long this took us (thanks to Kateryna Kaplan at Rutgers SCJ for her help with this arduous task!), but it proved to be a valuable experience. We ultimately excluded 510 incidents from the original dataset which didn’t meet our inclusion criteria—over 25% of the raw data we received from GVA!
A handful of cases were incredibly difficult to adjudicate and illustrate just how challenging it can be to boil down complex social realities into even seemingly straightforward variables like fatal/nonfatal. Consider Sgt. Ron Helus of the Ventura County Sheriff’s Department, who was shot six times while responding to an active shooter situation. Five of those shots were fired by the suspect, but the Coroner ruled that the sixth and ultimately fatal shot was fired from the rifle of another officer. We decided to retain this incident as a nonfatal shooting because, though we were certain he was shot by a suspect, we could not say whether he would have died had he not been struck in the heart by friendly fire. Others might have coded this incident differently. What is very clear is that this sort of data must be coded and analyzed with caution and transparency. Taking GVA data (or any crowdsourced data, for that matter) at face value is not advised.
We finish out the paper with discussion of future directions for research and data collection efforts focused on force by and against police. It’s scheduled for inclusion in the August 2020 Special Issue on Policing but will appear online first sometime before then.
In the meantime, click on the PDF button above to download the post-print (accepted) version of our paper.
We welcome your feedback!
* Note: I’ll accept positive feedback but please direct any negative feedback to Michael 😄