Last week’s post ended with a plea: if you know where historical counts of fatal police shootings live, tell me. A week later, I’m scouring old newspaper articles, and it’s been very productive.
Why newspapers
The original plan was to find the records police departments kept themselves (e.g., annual reports, internal affairs summaries, use-of-force reviews). That well ran dry fast. The Wayback Machine only began saving web pages in 1996, and the reports departments posted online mostly covered the 2000s, a decade Fatal Encounters already covers. Where older reports did turn up, they usually counted shooting incidents, not people killed. A six-agency pilot produced exactly two new years of usable counts (Jacksonville, 2007 and 2008).
Local papers, on the other hand, covered most police killings in their city, and many of them are now digitized and searchable through NewsBank’s Access World News. Some papers made it easy: the Omaha World-Herald ran a sidebar after each police killing listing every one in the past decade. Most didn’t, so for most cities I rebuilt each year case by case.1
How it works
A death counts when the paper reports that an on-duty officer of that agency shot and killed someone. Off-duty officers, other agencies at the same scene, and suicides during standoffs are left out.2
For each agency-year, I searched the paper several ways: full-text searches pairing kill phrases (“shot and killed,” “fatally wounded”) with the agency’s name, headline searches, and stories about prosecutors’ reviews of each shooting. Every case (and every exclusion) is logged with the article and its database ID in an evidence file, so anyone with access can check my work. Where a paper printed its own count (e.g., “the city’s fifth fatal police shooting this year”), I checked the reconstruction against it.
The method’s weakness is that it can miss deaths. If a story never ran, or ran under wording none of my searches anticipated, that death is missing, so the reconstructed counts are best read as floors. It also only reaches back as far as each paper’s archive (mostly the mid-1980s), and some cities are out of reach: Detroit’s papers aren’t in the database before 1995, and the Los Angeles Times isn’t in NewsBank at all.
What it added
Nineteen newspapers have now filled in years for 20 agencies, from Omaha and Oklahoma City to San Jose, Dallas, San Diego, and Kansas City: 256 agency-years and 471 people fatally shot. The orange tiles below are those newspaper years.
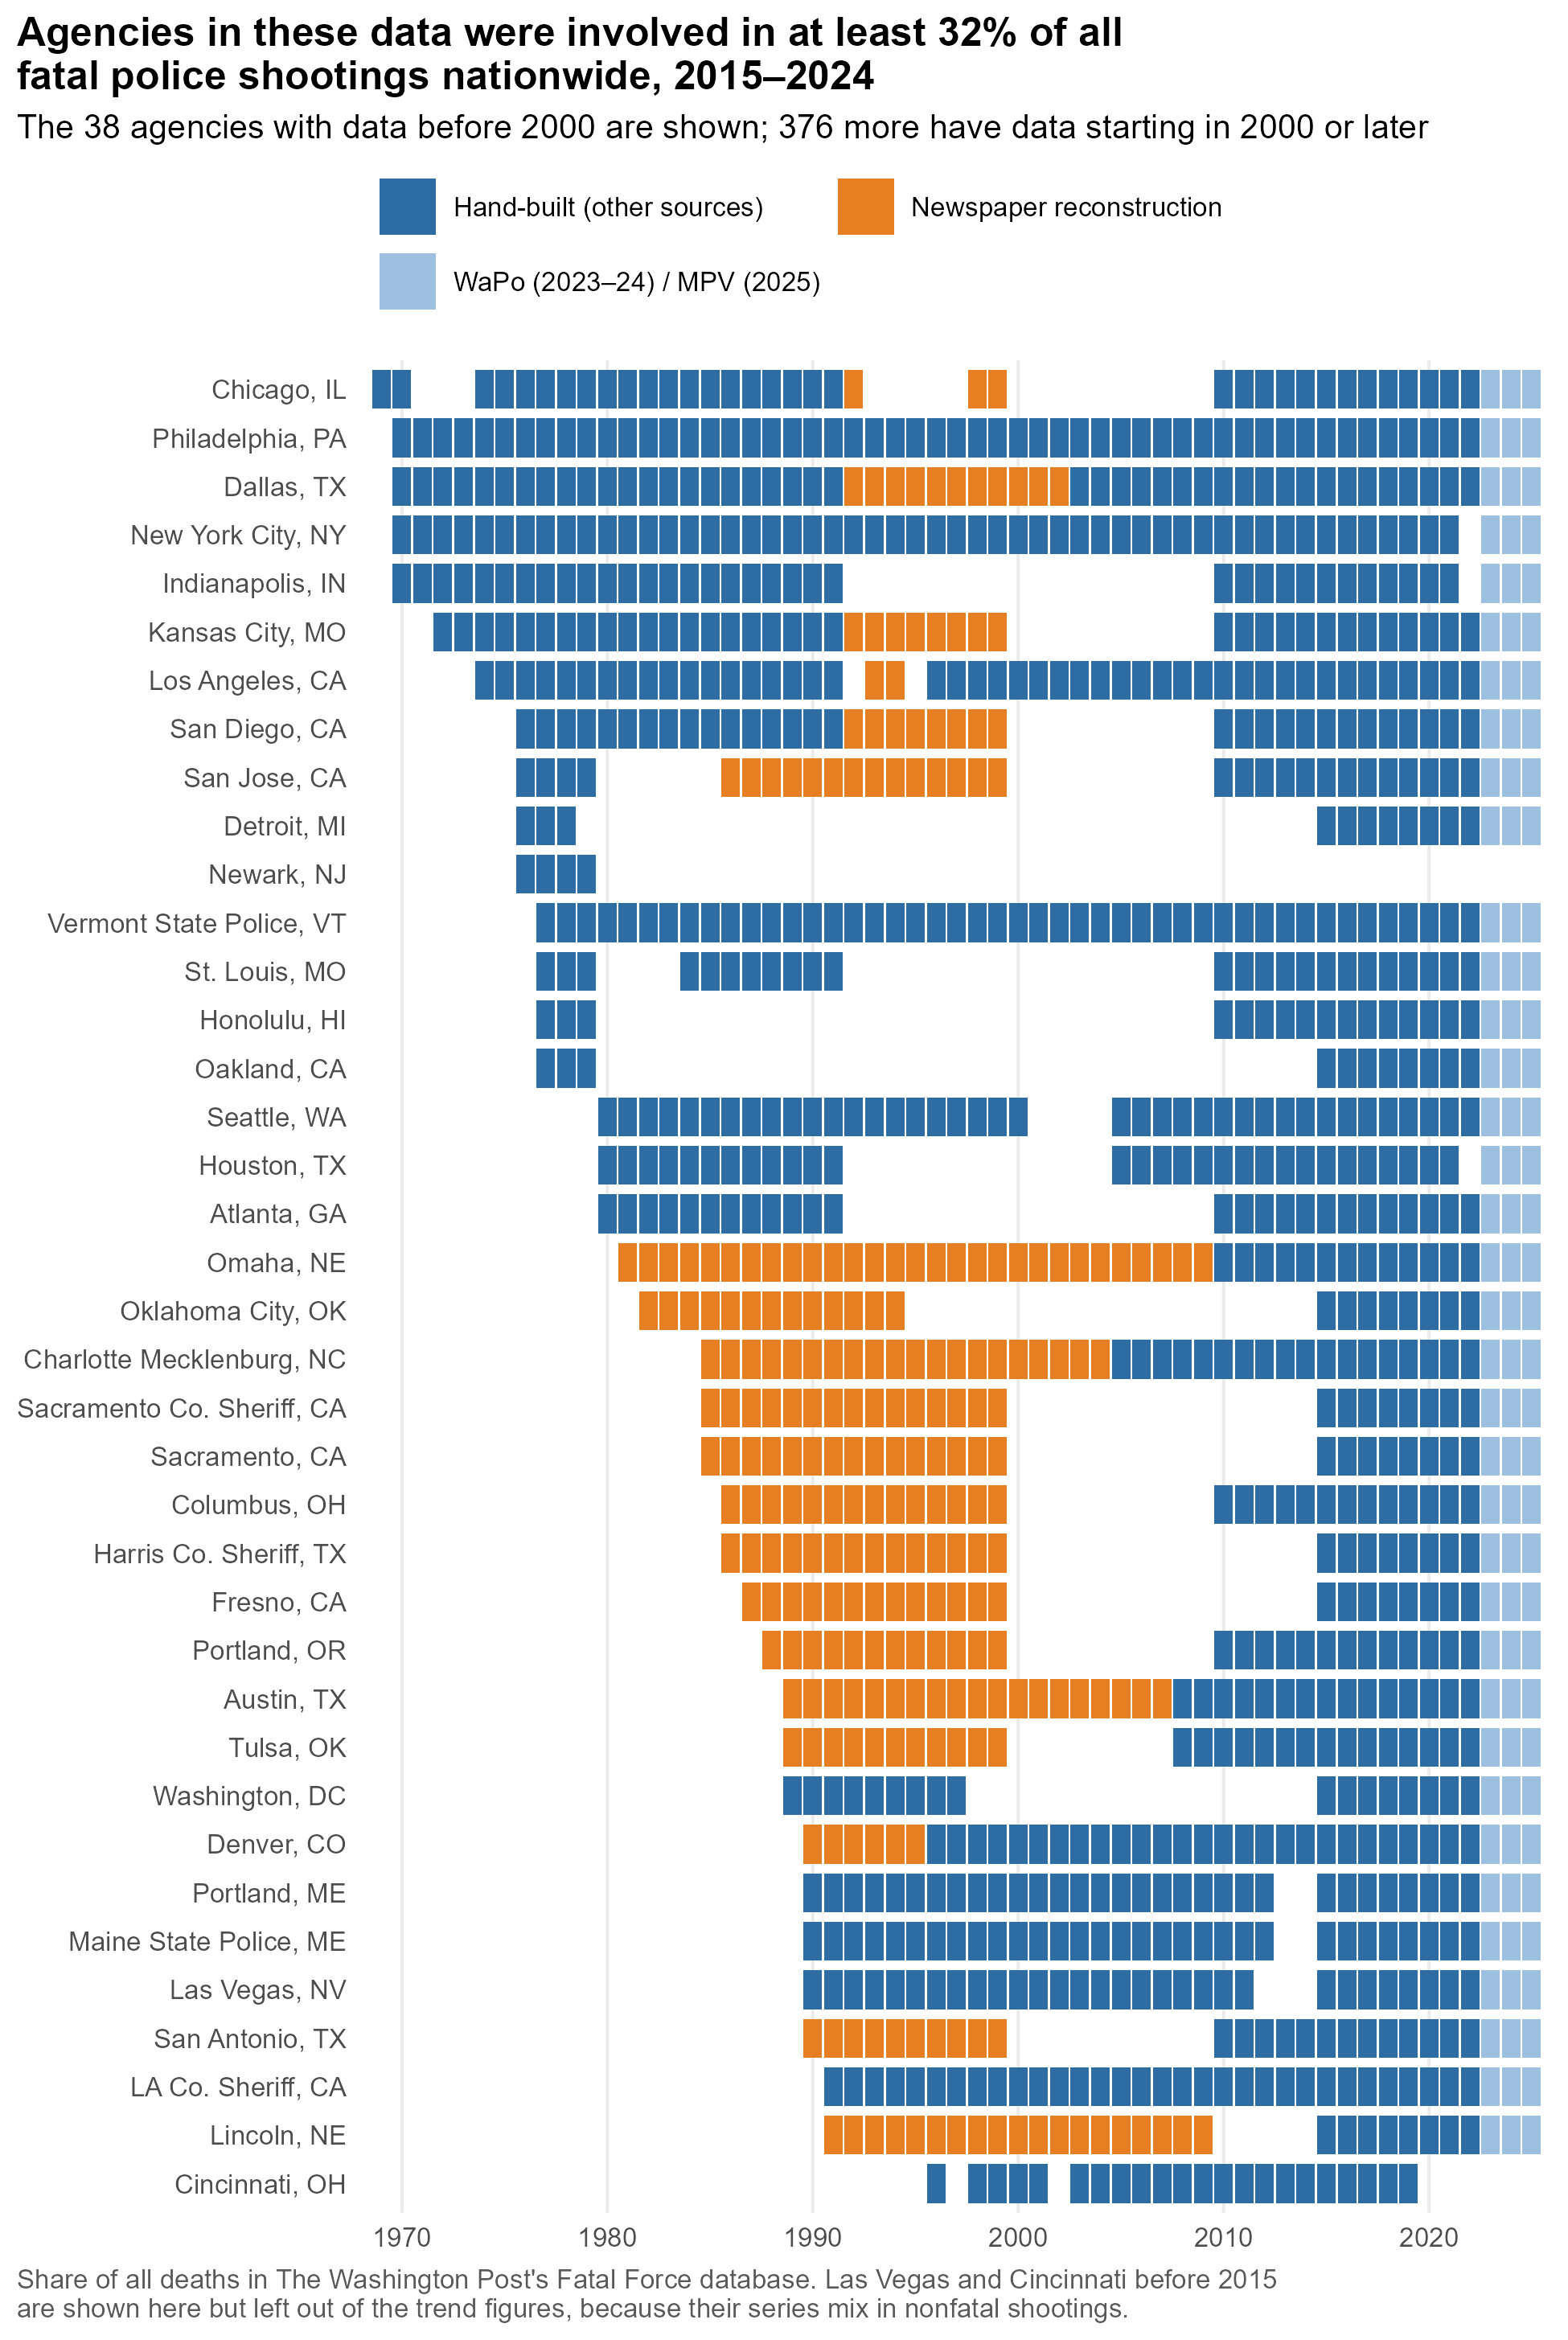
Last week, 25 agencies had any data before 2000. Now 38 do. More to the point, the number of agencies with at least five years of data both before 1995 and since 2015 has grown from 16 to 30.
Checking the papers against the FBI
How do I know the newspaper counts are any good? One rough check is the FBI’s Supplementary Homicide Reports (SHR), in which agencies are supposed to report every homicide, including people killed by police. I merged them into the panel using Jacob Kaplan’s cleaned files. SHR is a crude yardstick: it’s long been known to miss a large share of police killings, and it doesn’t record whether the officer was on duty.
Even so, the comparison is reassuring. In the agency-years both sources cover, the newspaper counts total 456 deaths and SHR 498, and the two match exactly in 133 of 239 agency-years. SHR running a little high is about what you’d expect, since it includes off-duty killings and my searches can miss cases.
Why not just use SHR, then? Because agency by agency, it has holes you could drive a patrol car through. In 1993, the Kansas City Star reported that city police had killed three people that year; SHR says none. And the gaps aren’t ancient history: SHR records no killings by NYPD officers from 2007 through 2014, years in which they shot and killed 84 people, and none by Chicago police from 2016 through 2022, when they killed 38.3
The headline moved
Last week I reported that in the 16 long-running agencies, fatal police shootings since 2015 ran about half their pre-1995 level. With 30 agencies, the gap narrows: shootings since 2015 run 31% below the 1970–1994 level, with an uncertainty range from 53% lower to just short of no change.
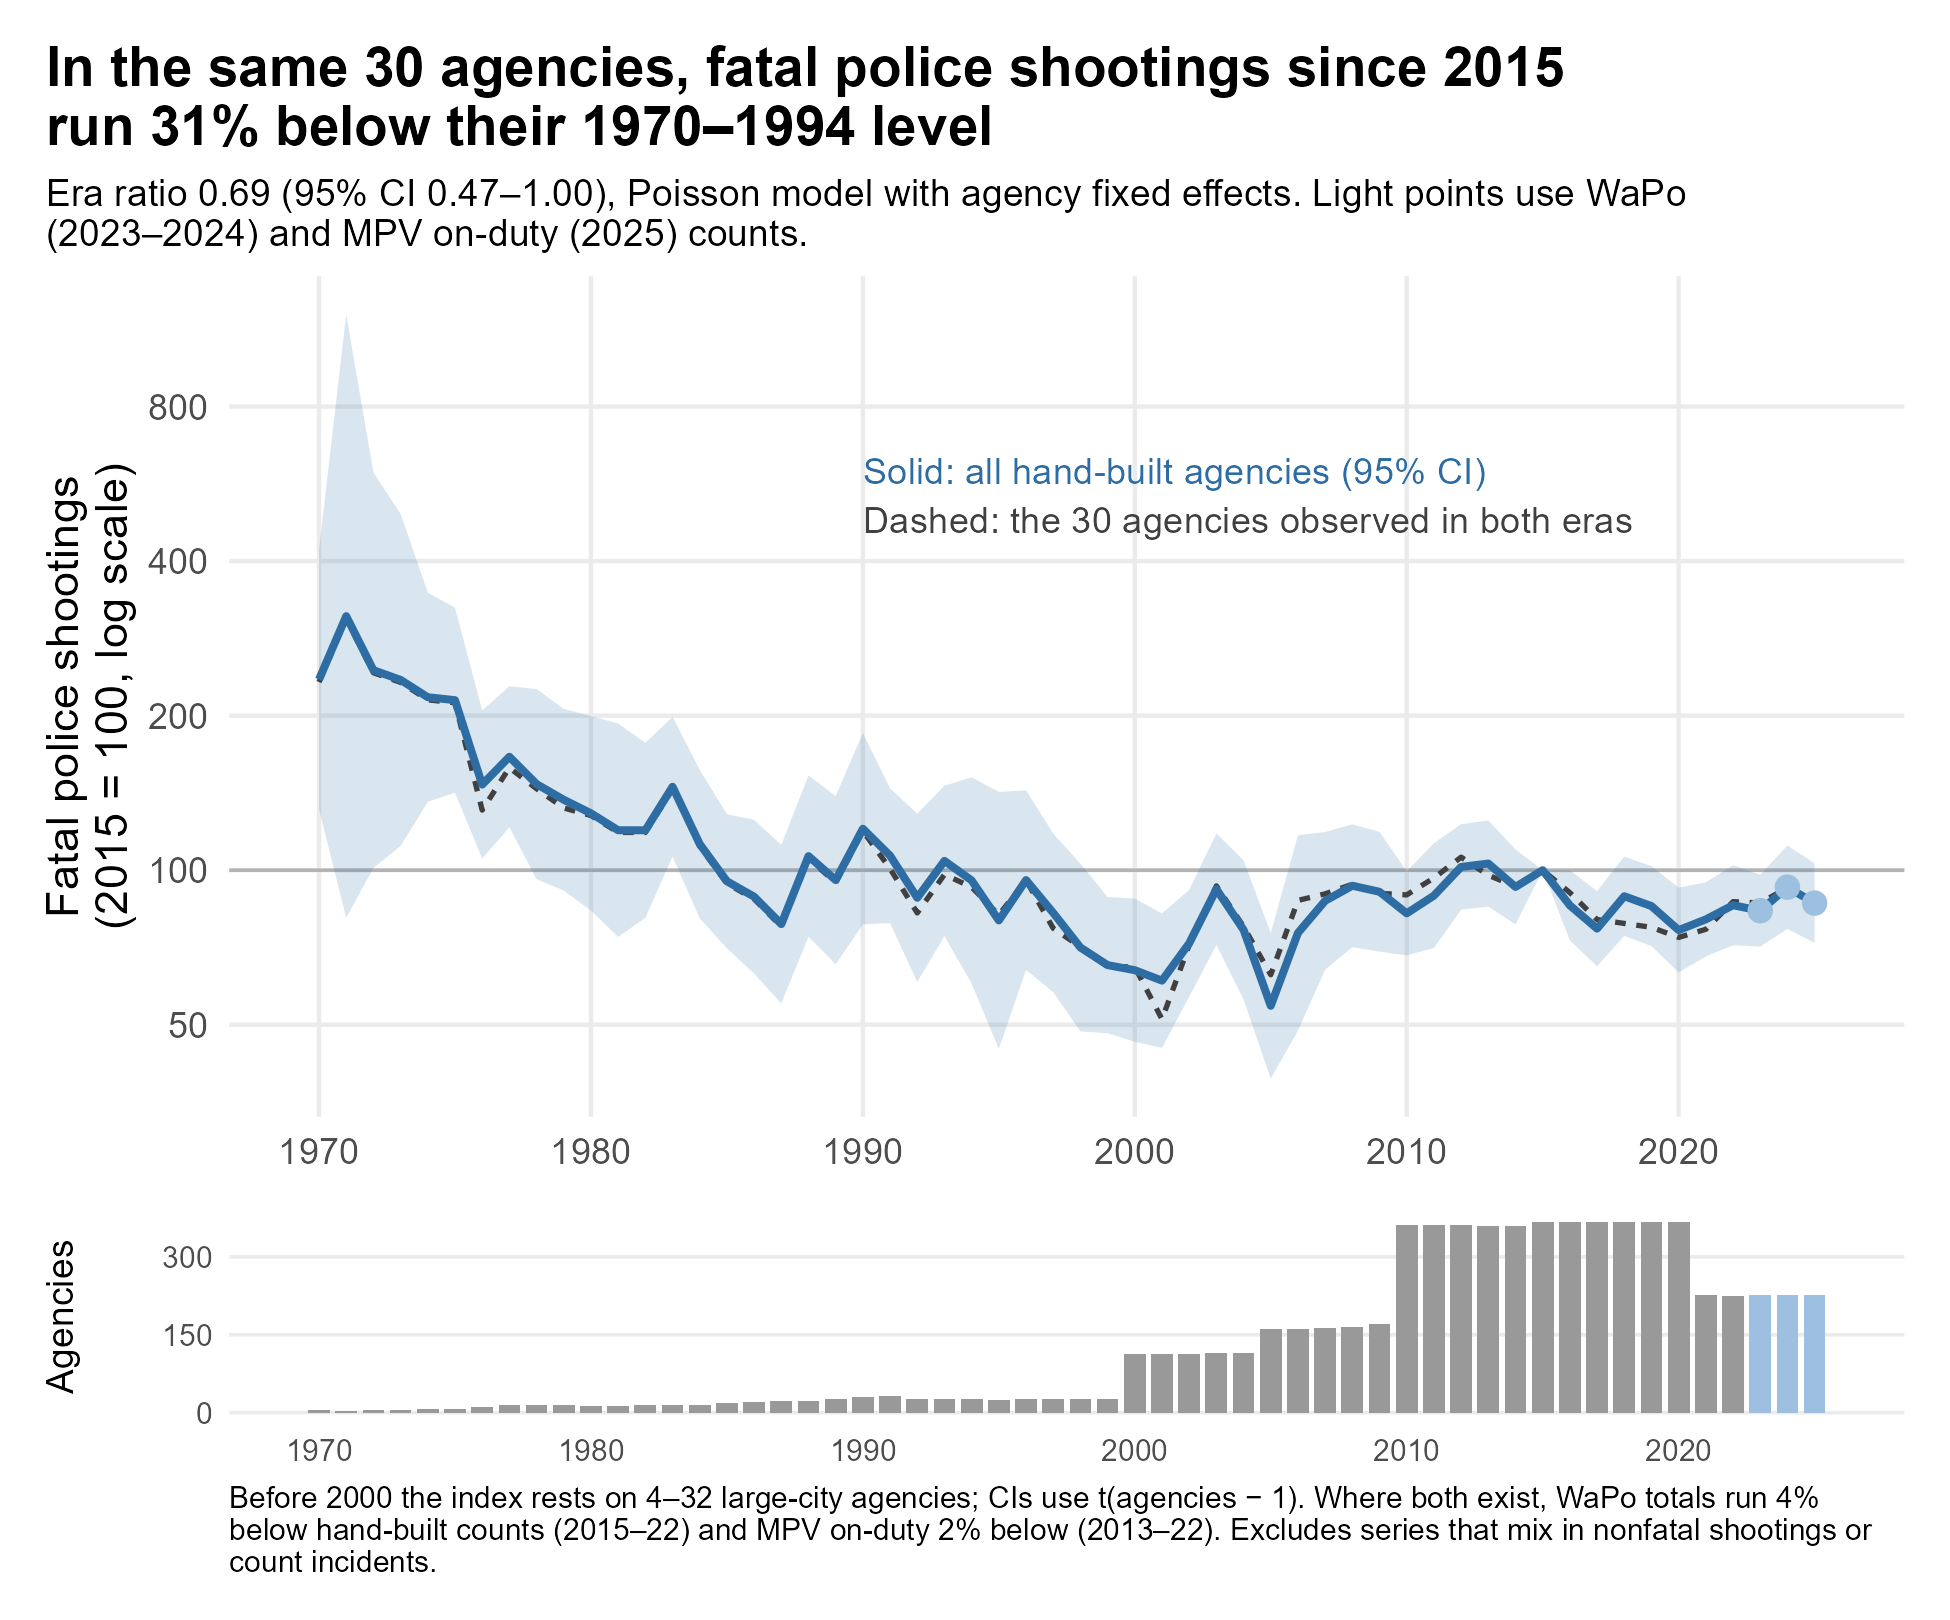
The change comes from which cities were added. Drop the newspaper years and the model returns last week’s answer. Take the 17 cities I rebuilt case by case on their own, and the ratio is 1.34: most of them do appear to be fatally shooting more people now than before 1995.4
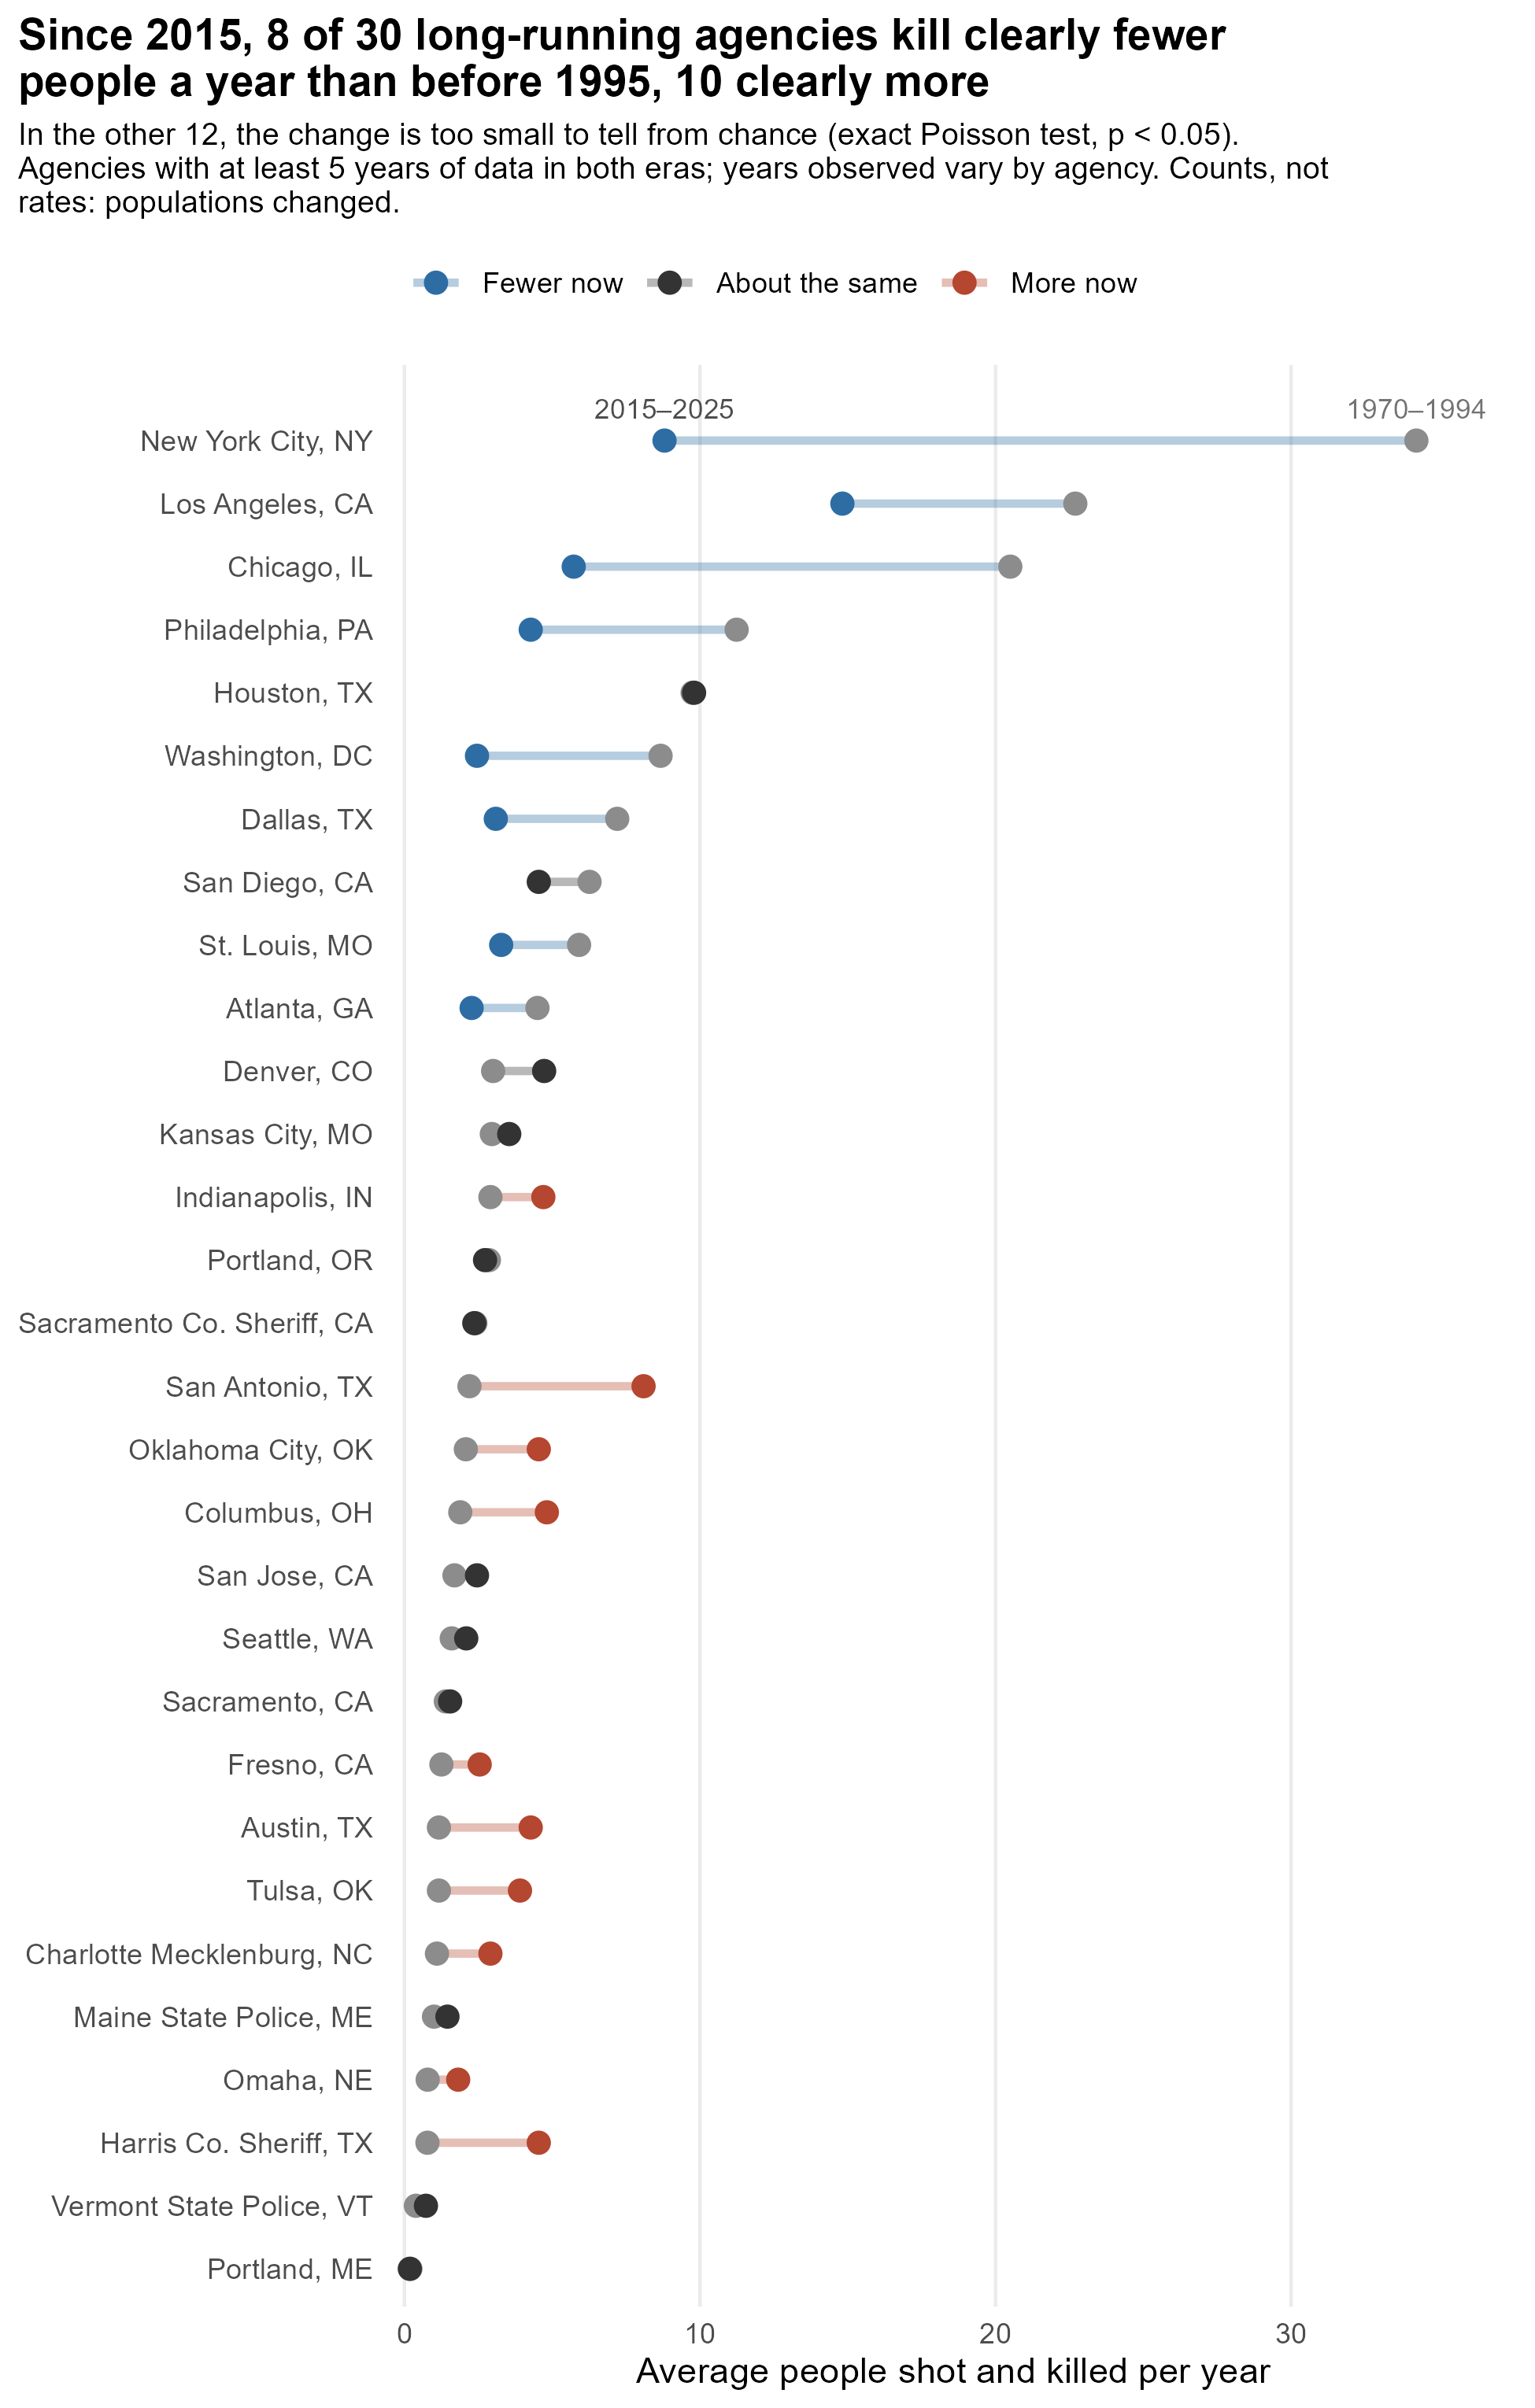
Many of those cities are fast-growing Sun Belt departments (San Antonio, Austin, Harris County), and these are raw counts, not rates. San Antonio’s population has grown by more than half since 1990.5 Could the newspapers’ misses explain the rest? To check, I raised every newspaper year to SHR’s count wherever SHR was higher, which overcorrects, since SHR also counts off-duty killings. The rebuilt cities drop to 1.23, still above their pre-1995 level on balance, and the headline barely moves (0.67).6 Of the 30 agencies, 8 kill clearly fewer people a year now than before 1995, 10 kill clearly more, and 12 haven’t changed by more than chance would explain.7
So the picture is more mixed than last week’s post suggested. The biggest departments (New York, Chicago, Los Angeles) are well below where they were. A lot of mid-sized and growing departments aren’t.
Still, recall what the Lancet estimate implies: with population growth, roughly twice as many deaths a year in the 2010s as in the 1980s. These 30 agencies show nothing like that. The pooled estimate is a 31% decline, and even the top of its uncertainty range is no increase. That’s not true of every agency, but it’s not what a doubling would look like.
What’s next
Indianapolis is out of reach (its papers aren’t in NewsBank), and so are most of Chicago’s missing years. If you can reach a paper I can’t, I’d love to hear from you. In particular, anyone with access to the Chicago Tribune for 1993–97, the Los Angeles Times (for the LA County Sheriff in 1989–90), the Detroit Free Press and Detroit News before 1995, or the Indianapolis Star in the 1990s could fill real gaps. Email me, or open an issue on GitHub.
Nineteen newspapers in, the long-run record is broader than it was a week ago, and a bit less tidy. That’s usually what more data does.
-
As with the rebuild I described last week, I had help from Claude, which drafted a case log for each year. I made the calls on the edge cases. Every case it logged links back to the article, so the work is checkable either way. ↩︎
-
The off-duty rule costs some deaths. In Harris County, for example, most of the gap between my count and SHR’s is deputies working uniformed extra jobs. I kept the rule anyway, because the modern sources I compare against are built around on-duty killings and I wanted the old and new eras measured the same way. A few edge cases (a joint raid with federal agents, a suspect who followed an undercover officer home) are flagged in the evidence file. ↩︎
-
Every count in this paragraph is in the panel (
agency_year_panel.csv), wheren_nixsits besiden_shrfor each agency and year. Each of these zeros comes from a year in which the agency did file SHR reports for its other homicides. It just didn’t report any killings by its own officers. ↩︎ -
Chicago and Los Angeles are set aside here because their newspaper years are the departments’ own counts rather than case-by-case rebuilds, and at their size they would swamp the comparison. With them, all 19 newspaper agencies together come to 0.87. ↩︎
-
From about 936,000 in 1990 to about 1.5 million today, per the Census Bureau. Austin roughly doubled over the same period. ↩︎
-
SHR files nothing for some of these agency-years, so the bound only raises years where SHR has a count. Every run is in
era_ratio_sensitivity.csv. ↩︎ -
“Clearly” means an exact Poisson test of each agency’s yearly rate in the two eras, at the conventional 5% level. Last week’s post counted every agency whose average was lower, however slightly, which is why it said 10 of 16 were lower. The table lists each agency’s years and rates. ↩︎